Retail Intelligence System
The system organizes retail transactions in an Oracle data warehouse and connects a star schema to Tableau dashboards for executive reporting, sales analysis, and scenario exploration.
Connecting Retail Transactions to Business Analysis
The Retail Intelligence System combines an Oracle data warehouse with Tableau dashboards to support analysis of sales, products, customers, and store operations. The project carries retail data from dimensional modeling into visual reporting, connecting database design with the questions business users need to investigate.
The Analytical Challenge
Retail transactions record individual business events, while reporting needs to reveal patterns across products, stores, customers, and time. Answering those questions directly from operational records can require repeated joins and reporting logic.
The project introduces a dedicated analytical model that organizes transaction-level facts around shared dimensions. Tableau dashboards use that foundation to present sales performance, contribution patterns, and business scenarios.
Warehouse and Reporting Architecture
The warehouse uses Oracle Database 11g on Oracle Linux. Its star schema separates transaction facts from descriptive dimensions, giving analytical queries a consistent structure for grouping and comparing retail activity.
| Component | Implementation | Analytical Role |
|---|---|---|
| Database environment | Oracle Database 11g on Oracle Linux | Hosts the retail warehouse. |
| Fact data | Transaction-level records | Supplies the business events used in analysis. |
| Dimensions | Product, customer, time, and store-related attributes | Provides context for filtering and aggregation. |
| Reporting layer | Tableau dashboards | Presents summaries, trends, and scenario views. |
The star schema establishes the relationship between business events and their context. Time attributes support period-based comparisons; product and store attributes support contribution analysis across different parts of the retail operation.
Database Design and Analytical Access
The database work covers warehouse schema design, environment setup, and the organization of data for analytical queries. Availability and concurrent read and write access were design considerations for the Oracle environment.
Connecting the warehouse to Tableau carries the dimensional model into the reporting layer. This allows the dashboard views to address different business questions using a shared data foundation.
Dashboard Modules
Executive Performance
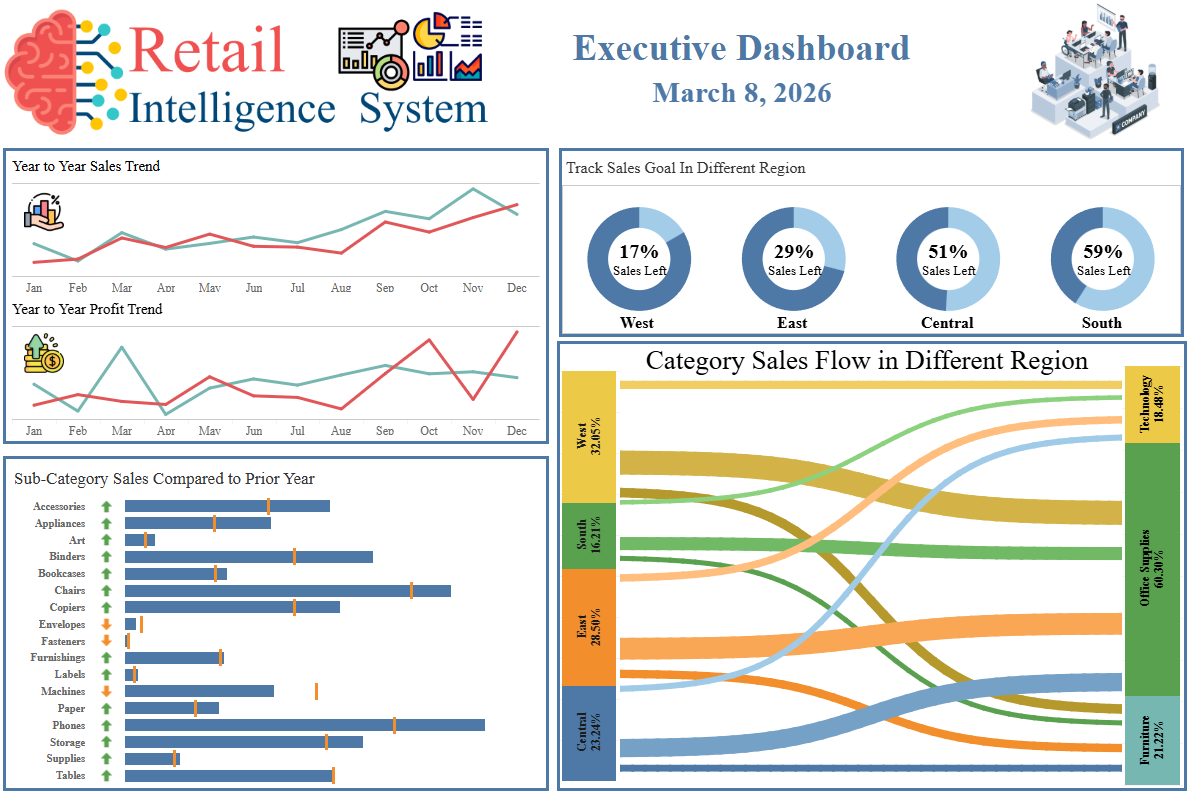
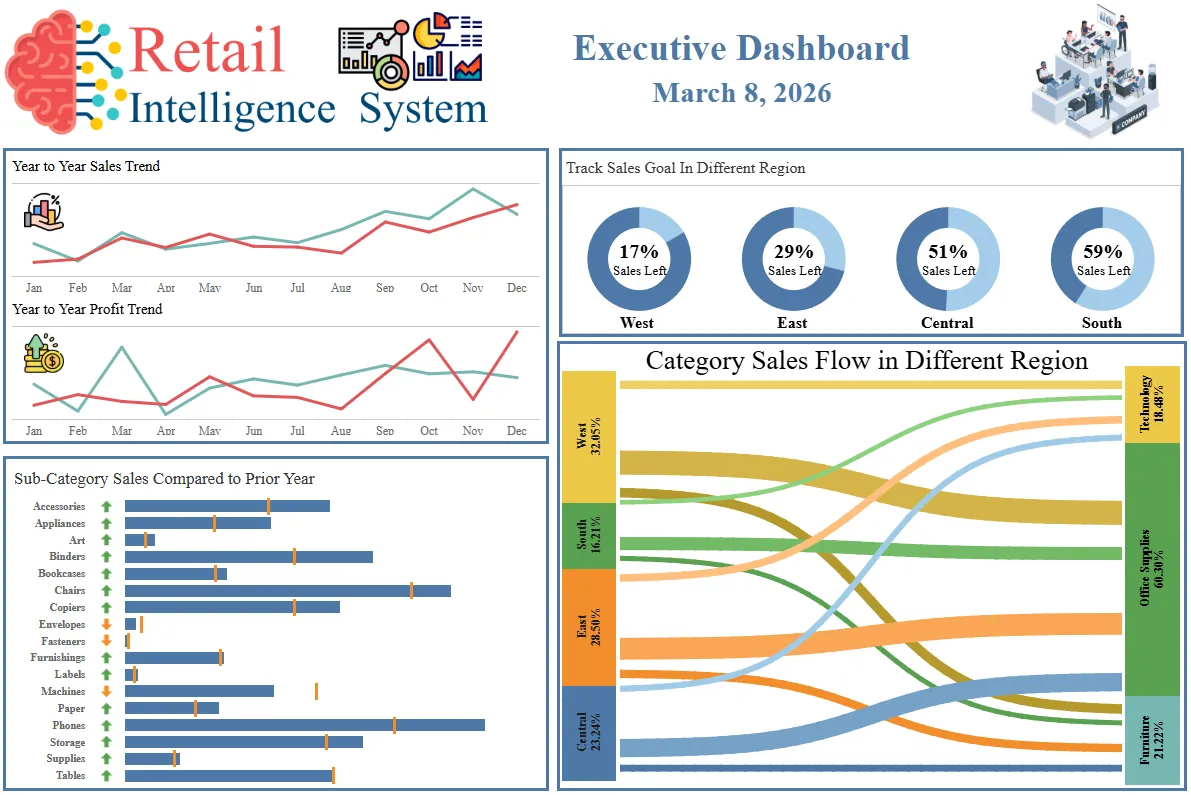
The executive dashboard summarizes retail performance through sales trends, revenue contribution, and key performance indicators. It provides an overview for users who need to assess business activity before exploring more specific questions.
Sales Contribution and Pareto Analysis
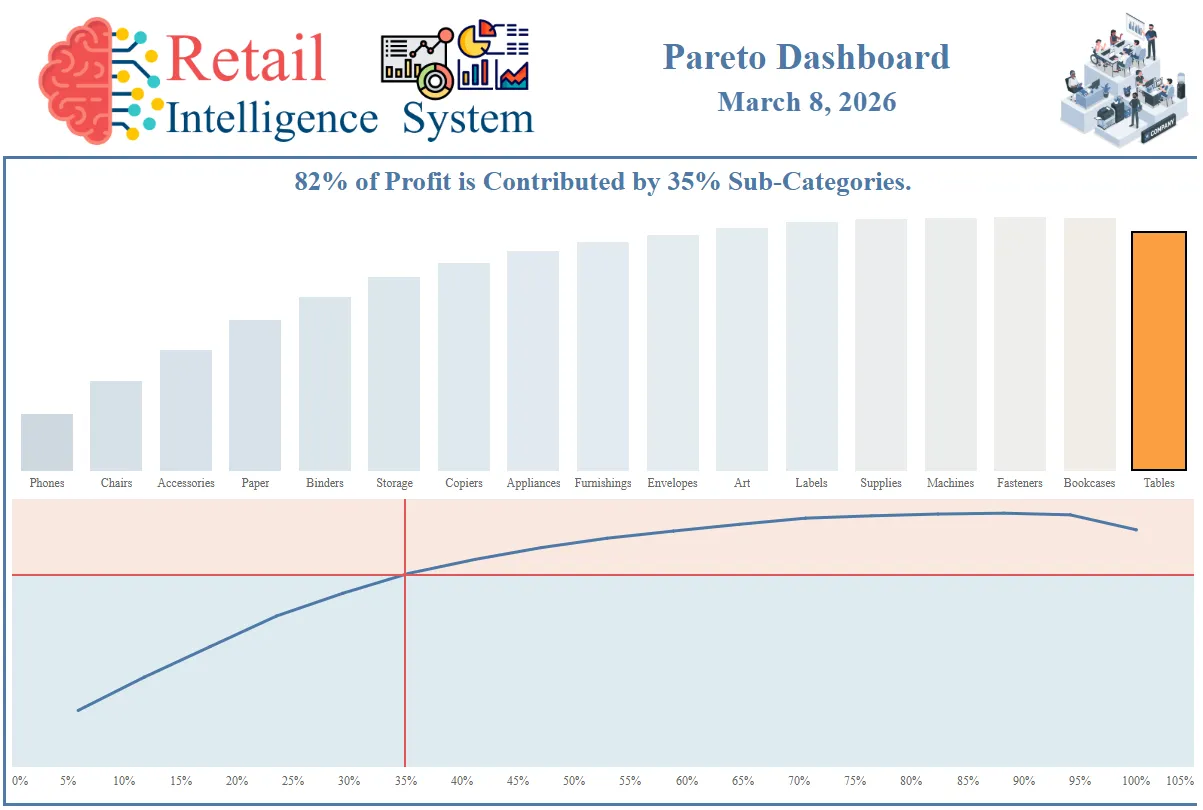
The Pareto dashboard examines how sales are distributed across products or categories. Its purpose is to identify where contribution is concentrated and support discussions about inventory, marketing, and sales priorities.
What-If Scenarios
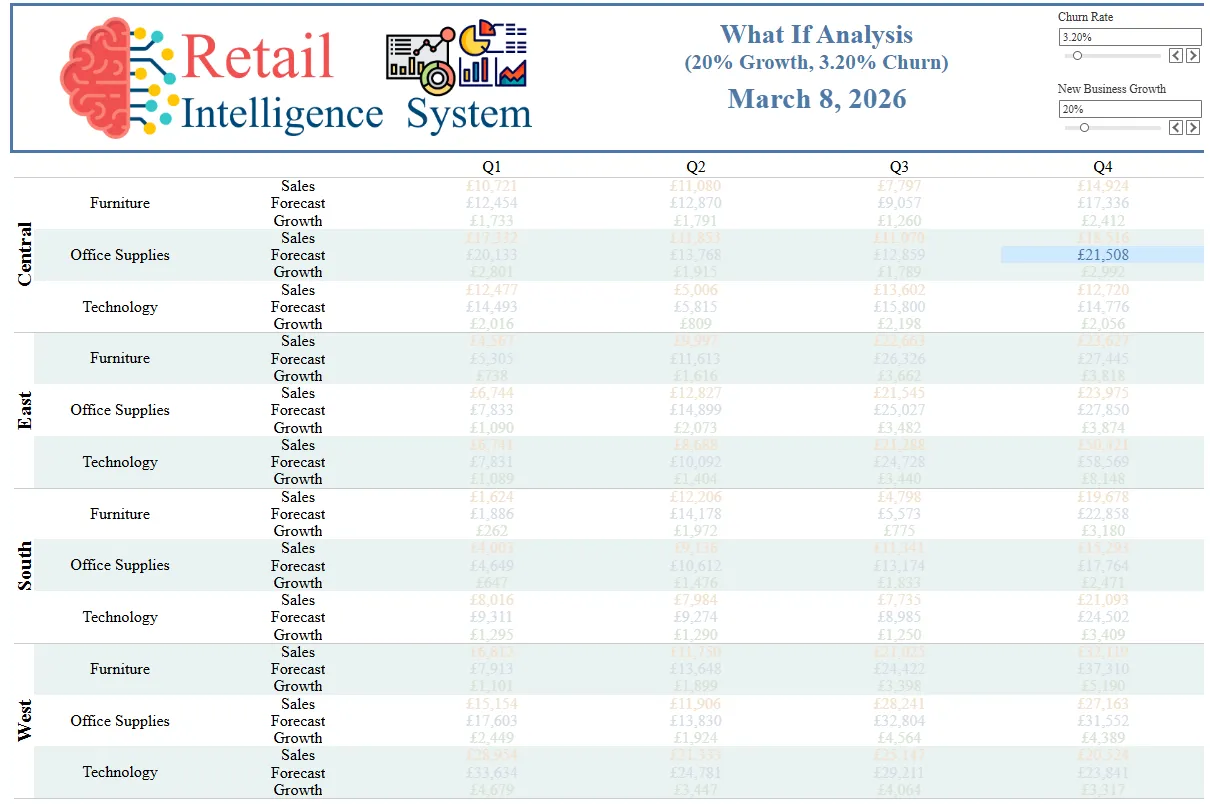
The what-if dashboard supports exploration of how changes in selected variables may affect retail performance. This gives business users a way to examine scenarios alongside the historical reporting views.
Performance Over Time
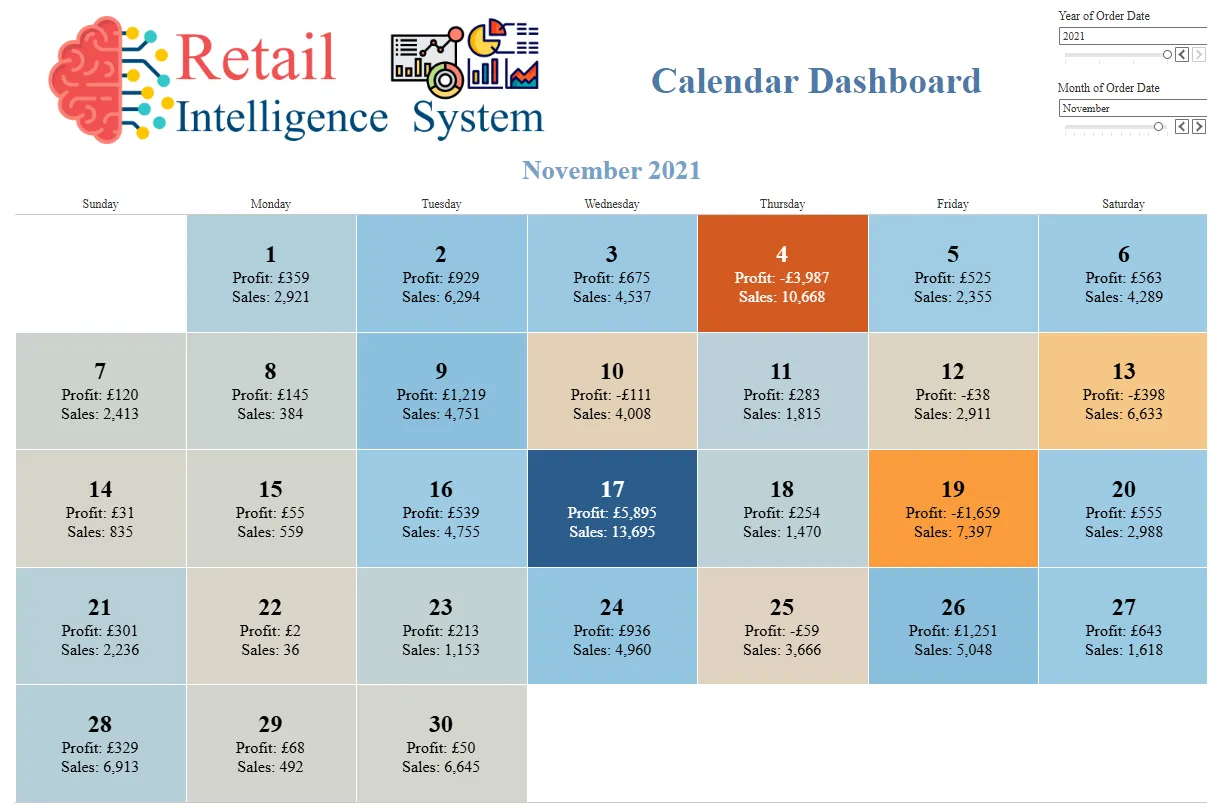
The calendar dashboard presents performance by date, helping users inspect recurring patterns, seasonal variation, and changes across reporting periods.
Accessible Data Presentation
The reporting design considers users with different levels of technical knowledge, including visual and cognitive accessibility needs. Clear presentation and ethical interpretation of data are design priorities, with the dashboards intended to make business questions approachable without requiring users to work directly with database queries.
Deliverables and Analytical Value
The project delivers an Oracle warehouse environment, a retail star schema, and four Tableau dashboard modules. Together, these components connect transaction-level data with executive reporting, contribution analysis, scenario exploration, and calendar-based views.
The engineering contribution spans the database and reporting layers: structuring retail facts and dimensions, connecting the model to Tableau, and translating business questions into focused visual reports.